Inspecting the catalog
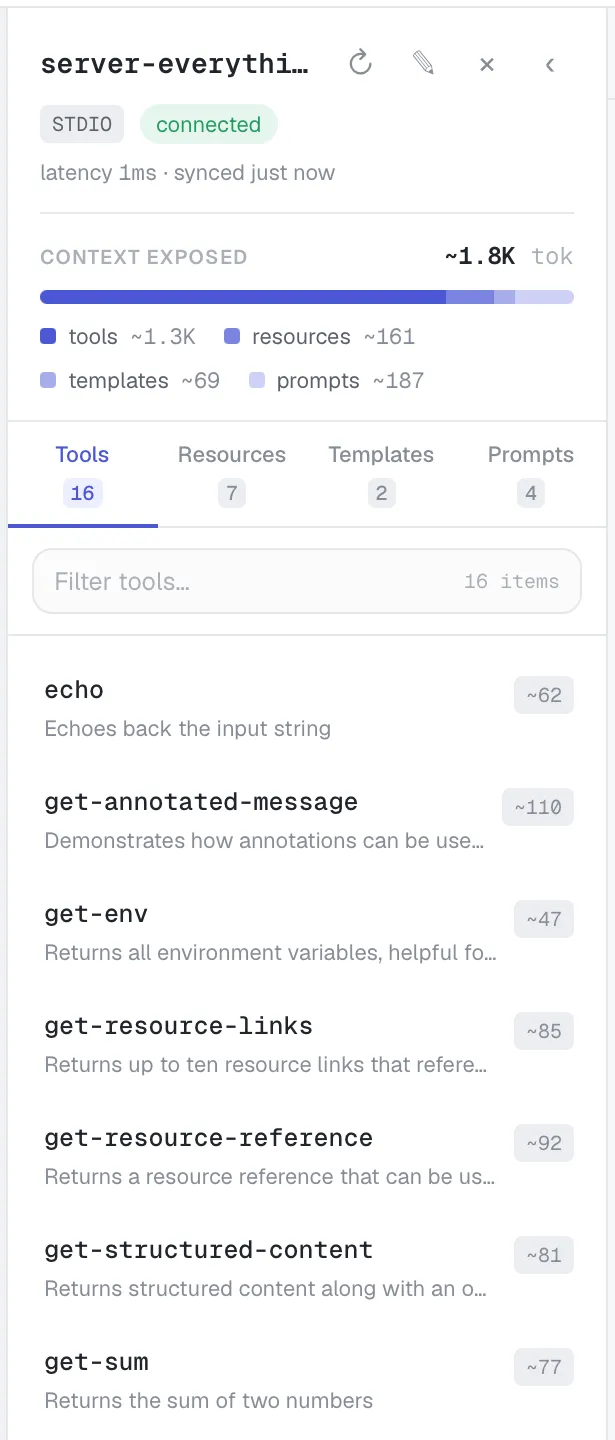
The middle pane — the explorer (or catalog) — lists everything a server exposes, across four tabs: Tools, Resources, Templates and Prompts. Each tab shows a count, and each item row shows its name, an optional description, and a ~N token estimate.
Context exposed
Section titled “Context exposed”Each server has a “Context exposed” summary showing the total ~N tok it would add to a model’s context, with a four-colour ramp broken down by kind (tools / resources / templates / prompts). It’s the quick answer to “how much context does this server cost me?”
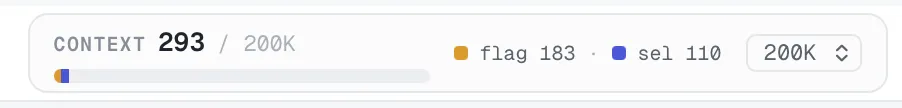
The top bar also carries a Context meter with a Context budget selector (128K / 200K / 1M), so you can see flagged and selected token counts against a chosen window.
Browsing & filtering
Section titled “Browsing & filtering”- Select a server on the rail.
- Pick a kind tab (Tools / Resources / Templates / Prompts).
- Filter the list with the “Filter {kind}…” box (from the filter box, ↓ moves into the list; ↑/↓ navigate it).
- Click an item to open it in the Inspector on the right.
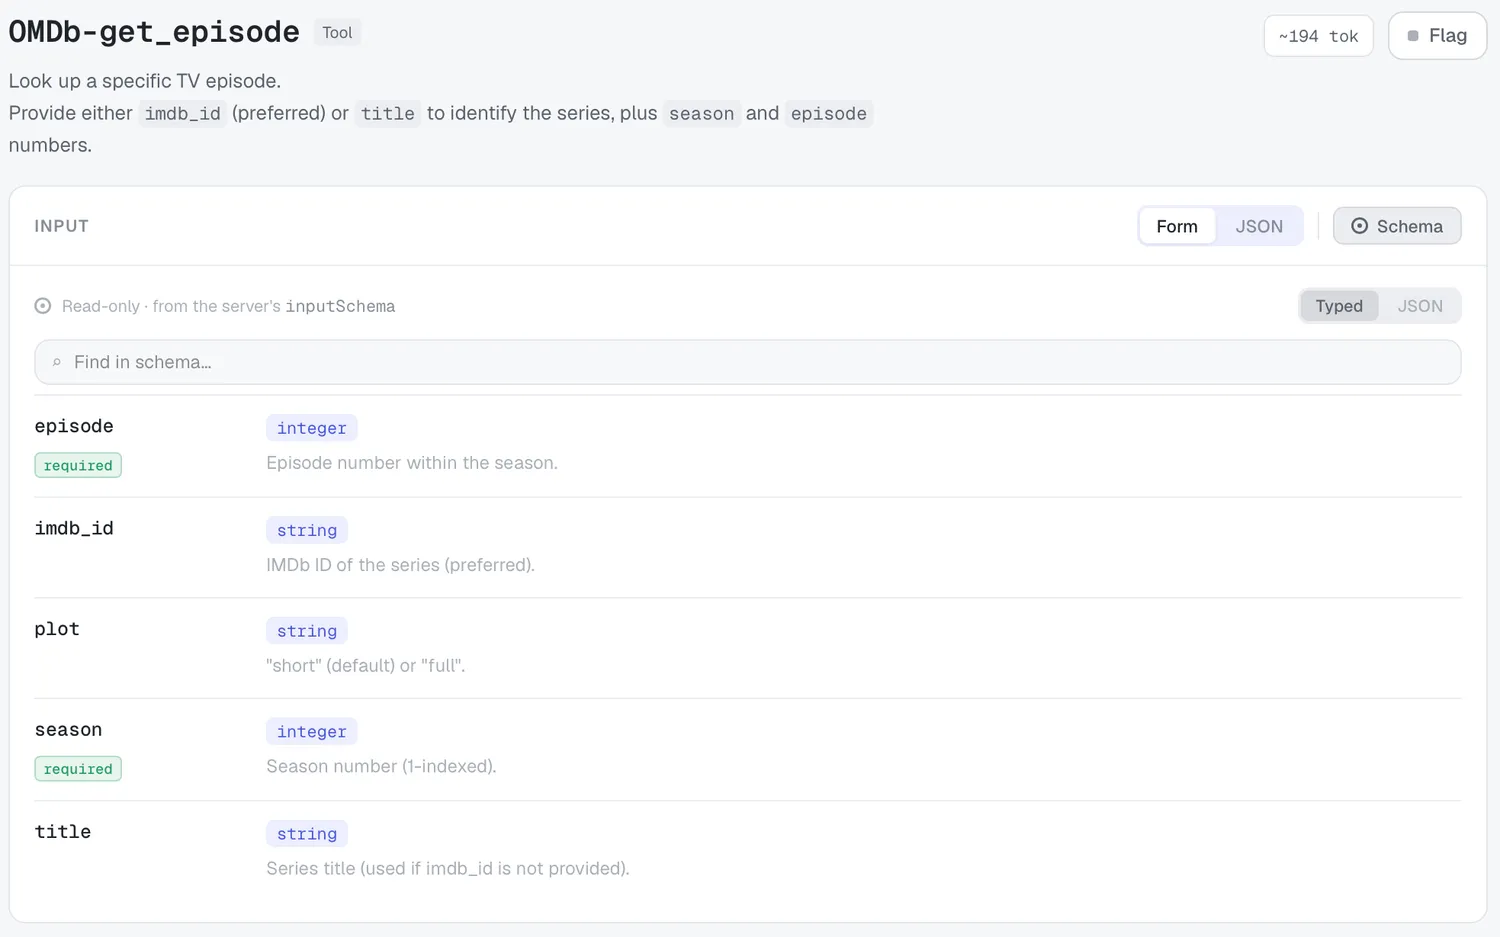
The Inspector header shows the item name, a kind badge (Tool / Resource / Template / Prompt), and a ~N tok chip.
Reading the schema
Section titled “Reading the schema”The Schema button opens a read-only view — “Read-only · from the server’s inputSchema” — with Typed and JSON modes and a “Find in schema…” box.
Flagging
Section titled “Flagging”The Flag button marks an item as Flagged for changes (it turns amber). Flagged items are surfaced in the list as “Flagged · …” and feed the review brief.
Empty states
Section titled “Empty states”- “No {kind} reported” — connected, but the server exposes none of that kind.
- “No {kind} match” — your filter excluded everything.